
Property prices fell nationally for the first time since the pandemic began during May, and with interest rates likely to rise further over the coming months we expect the rate of decline to accelerate.
Since the middle of last year the rate of price growth nationally has been slowing and that continued in May with dwelling prices nationally falling and the annual rate of growth continuing to decelerate rapidly.
In May we also got the first interest rate increase since November 2010. After a 35 basis point increase in May, the Reserve Bank of Australia followed up with an extra-large 50 basis point increase in June. The Reserve Bank has signalled it will be aggressively lifting rates from here to attempt to quell inflation.
The number of new listings remained strong in May 2022 with a 9.1% monthly increase and a 5.8% year-on-year increase. Total listings also increased over the month, up by 4.4% however, they were still 4.9% lower year-on-year.
Along with the rise in overall listings there was also an increase in the number of potential buyers which rose 0.6% over the month. Although the number of potential buyers was higher, the larger increase in total listings offset this during the month.
The clear trend across the data is that the heat continues to come out of the market. With the RBA’s statement this month alluding to a faster and greater increase in the cash rate, this is expected to lead to larger price falls in the housing market.
From here, interest rates are expected to continue to climb which is likely to reduce demand for properties and lead to an acceleration in the decline in prices.
At this stage the greatest weakness in the market is evident at the higher price points.
Although the impending conditions could discourage listings, renovation costs are booming which is likely to discourage people from doing so and potentially consider moving instead. Most sellers are buying in the same market and if they are upgrading the larger falls for higher-priced properties may be beneficial.
Let’s take a look at market activity across the states and territories.

New South Wales
Dwelling prices in Sydney fell a further 0.3% in May, taking annual growth to 10.2%. In regional NSW, prices rose by 0.2% during the month to be 22.4% higher year-on-year.
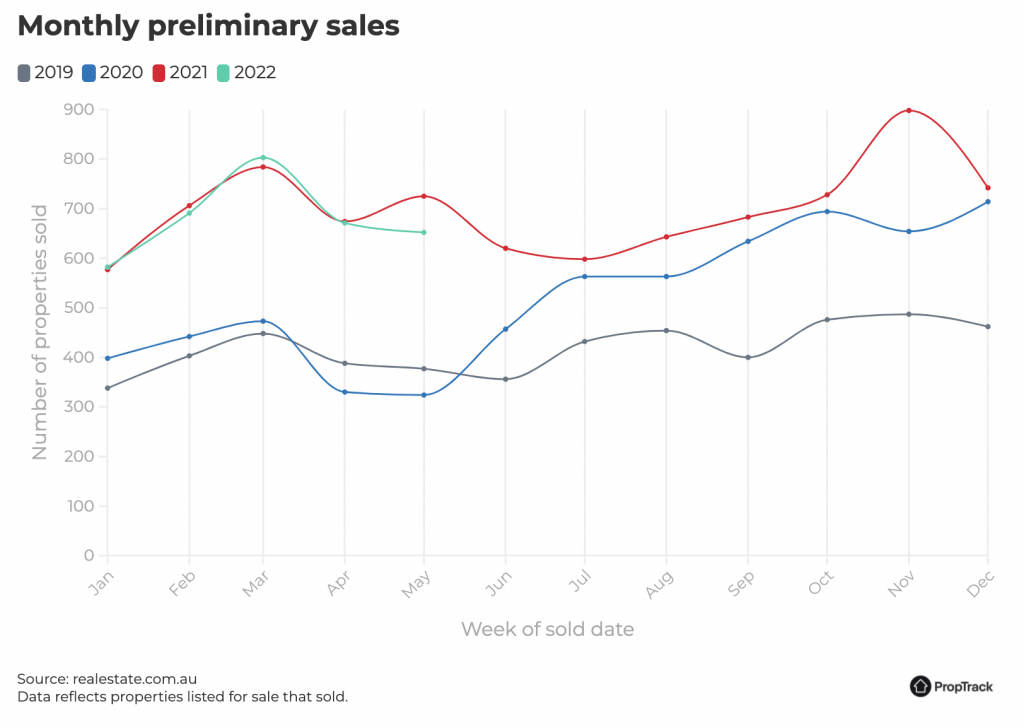
Sales volumes
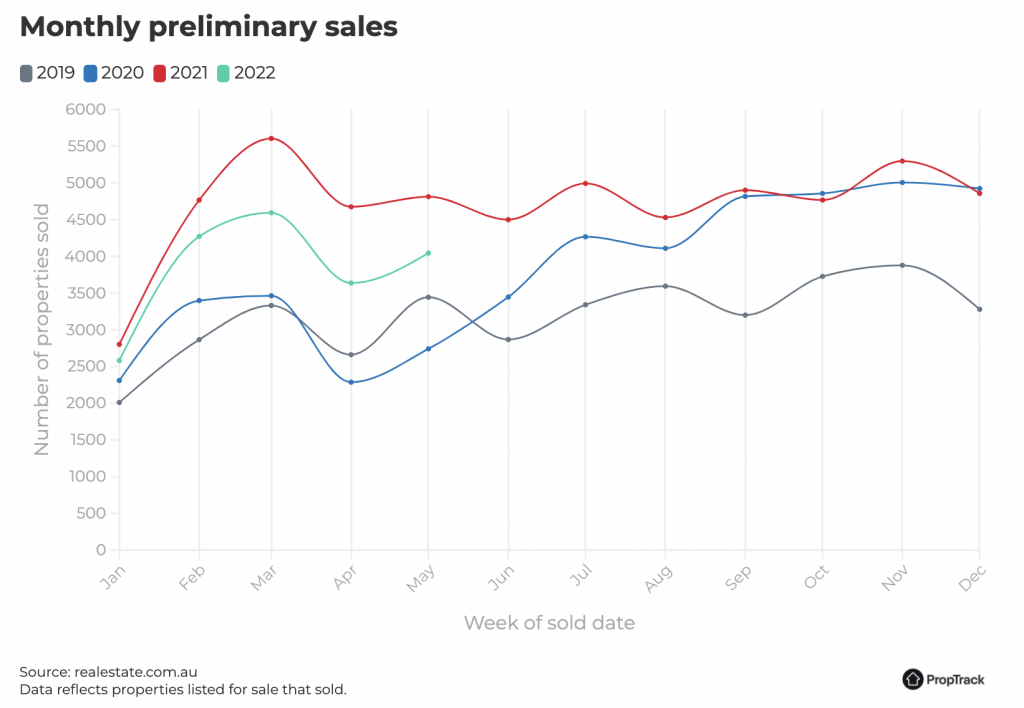
Monthly preliminary sales volumes in Sydney are down 13.5% over the first five months of this year compared to the same period last year. In regional NSW, preliminary sales were 15.6% lower.
Days on site
Properties are taking longer to sell in the capital, with properties listed for a median 31 days in May before selling, which was up from 29 days the previous month and 25 days in May 2021.
In regional NSW days on site also increased over the month from 36 days to 40 days which was also higher than the 34 days a year ago.
Victoria
Melbourne prices recorded a monthly fall of 0.3% in May, their largest fall since April 2020 while on an annual basis prices were 7.5% higher.
In regional Victoria, prices also fell 0.3% over the month, their largest fall since May 2019, while over the past year prices were 18.1% higher.
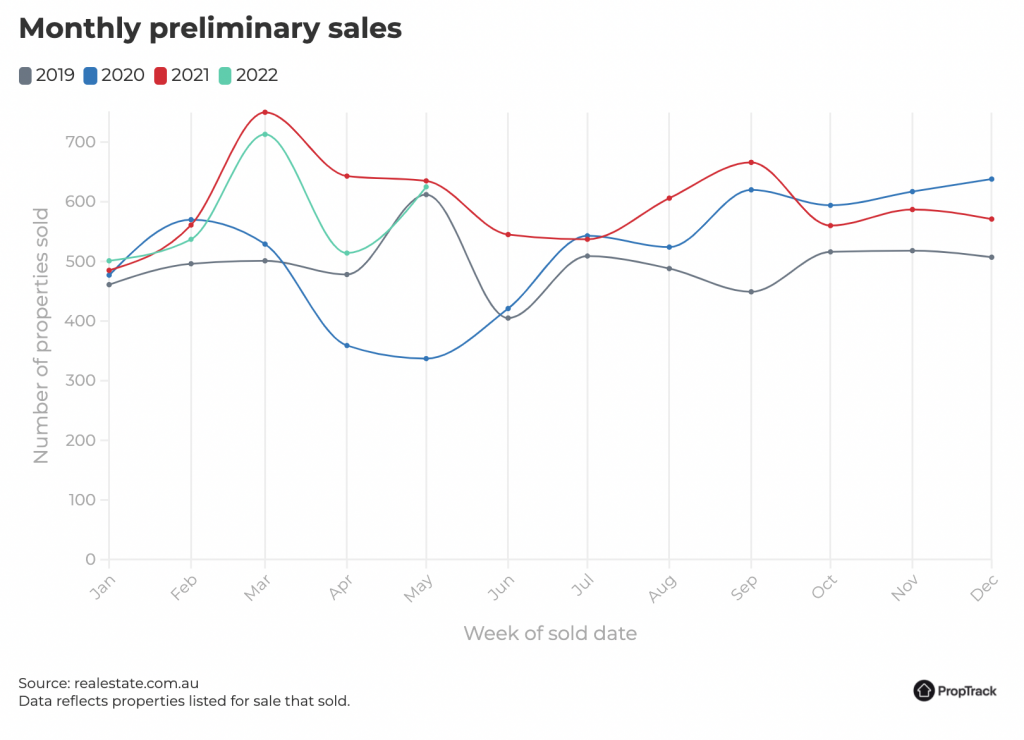
Sales volumes
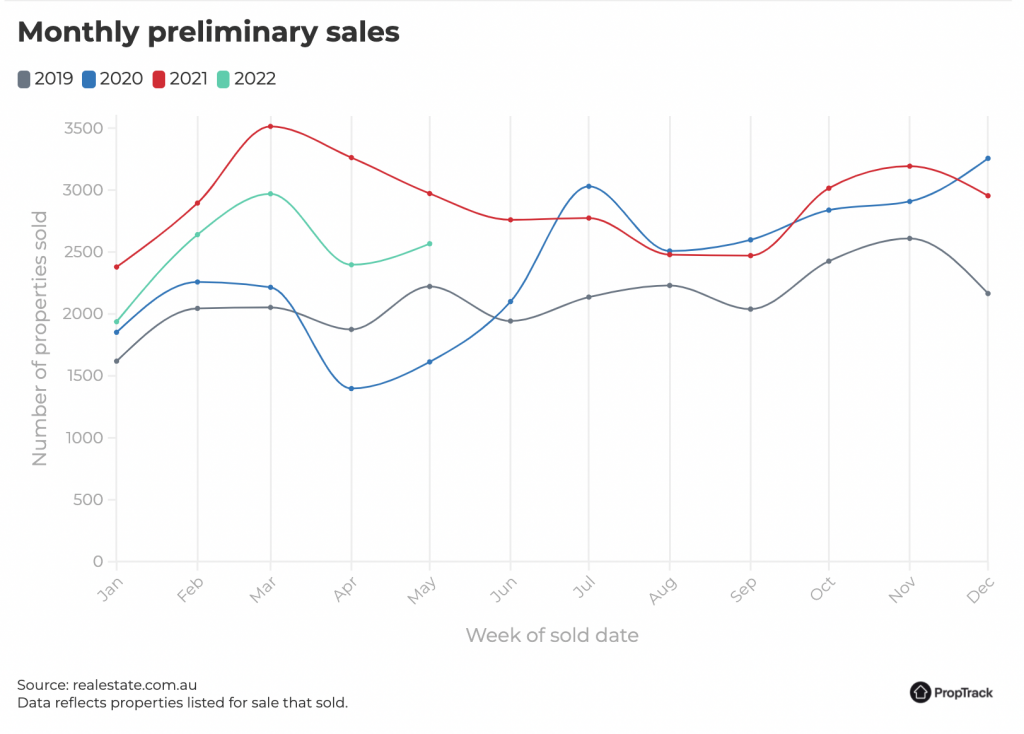
There were 0.1% more preliminary sales over the month in Melbourne in May 2022 and 7.1% more in regional Vic.
Over the first five months of this year there has been 6.3% fewer preliminary sales than over the same period last year in Melbourne and 16.7% fewer sales in regional Victoria.
Days on site
Typical days on site in Melbourne increased slightly to 30 days in May, which was higher than the 27 days recorded a year ago.
In regional Victoria, days on site rose from 38 days in April to 45 days in May which was also higher than the 41 days a year earlier.
Potential buyers
The number of potential buyers in Melbourne rose 0.6% in May and was unchanged year-on-year however, once adjusted for listings, potential buyers per listing were 1.5% lower over the month and 0.5% lower year-on-year.
In regional Victoria, potential buyers were 2.8% lower over the month and 4.6% lower on a per listing basis, while year-on-year there was 2.7% more potential buyers but that figure was 6% lower on a per listing basis.
Property listings
Melbourne recorded a 12.4% monthly increase in new listings in May which took them 4.5% higher year-on-year and 22.3% higher than their decade average. In regional Vic, new listings were 2.4% lower over the month, 9.5% higher year-on-year but 5.5% lower than their decade average.
Total listings in Melbourne in May were higher over both the month (3.3%) and year (1.5%) taking them 1.1% higher than the decade average. In regional Victoria, total listings were also higher over the month (3.3%) and year (12%) but 50.2% below their decade average.
Queensland
Brisbane dwelling prices increased by 0.4% in May, their slowest monthly growth since May 2020. In regional Queensland, prices fell 0.2%, their first decline since December 2019.
Year-on-year prices have risen by 25.9% in Brisbane while in regional areas, prices were 23.3% higher.
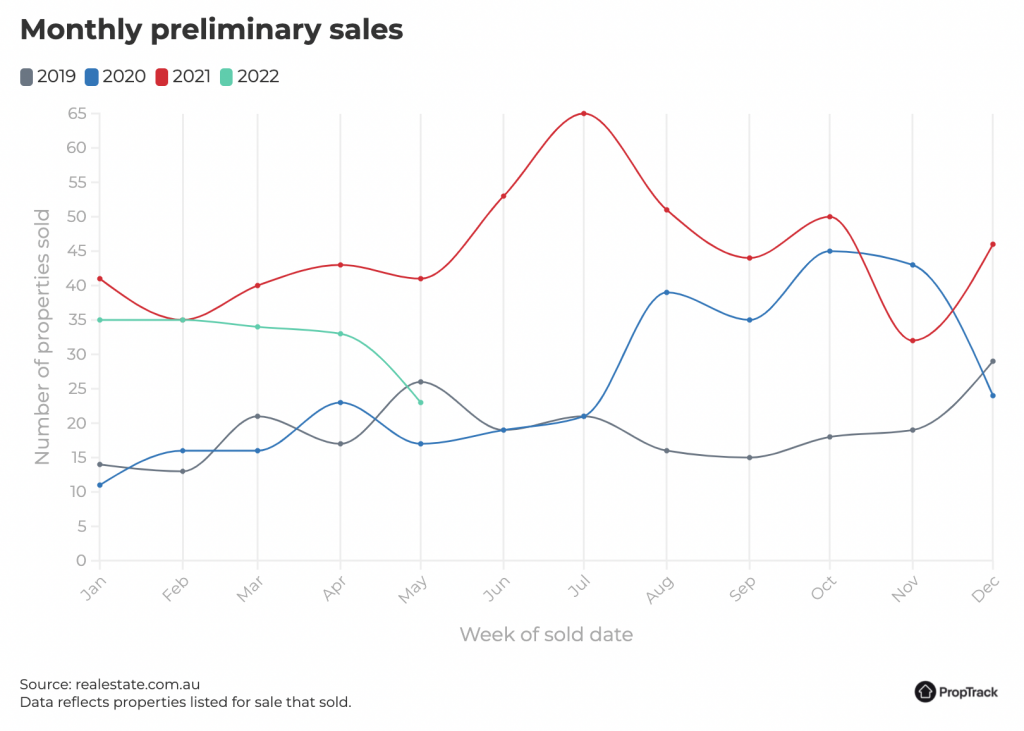
Sales volumes
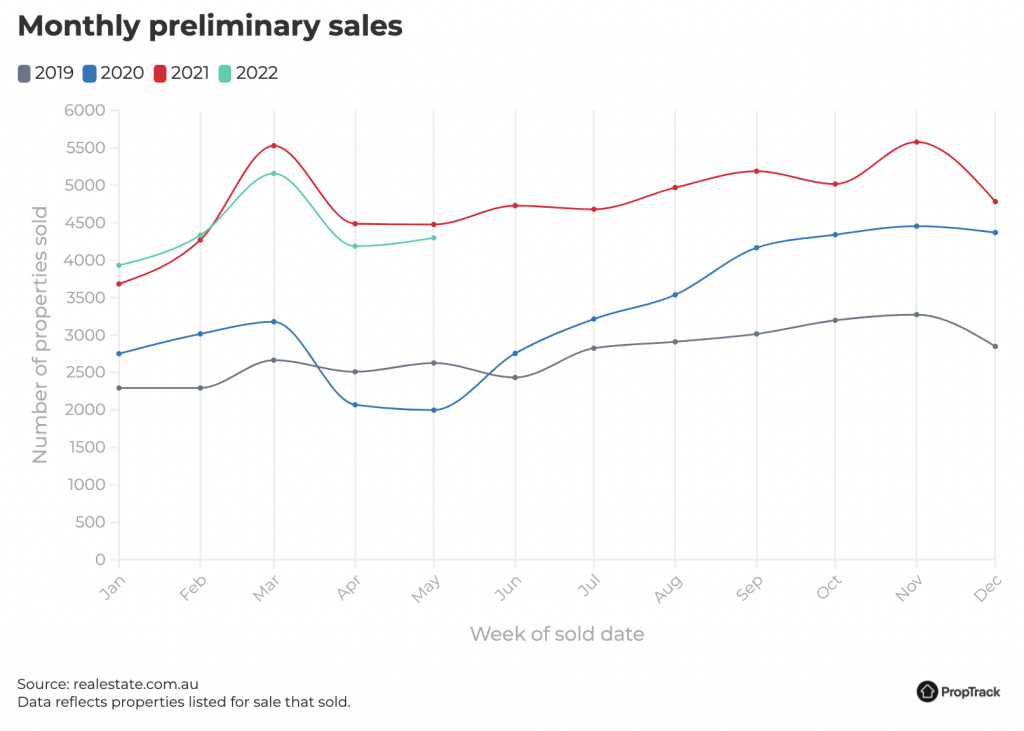
In Brisbane, preliminary sales volumes are 2.6% lower over the first five months of this year compared to the same period last year. In regional Queensland, preliminary sales are down 1.9% this year comparing the first five months of each year.
Days on site
Brisbane experienced a big increase in days on site in May, rising to 42 days from 31 days in April.
In regional Queensland, days on site was 54 days in May, up from 49 days the previous month but marginally lower than the 55 days a year earlier.
Potential buyers
The number of potential buyers per listing fell 2.1% in Brisbane and 0.7% in regional Queensland during the month.
On a year-on-year basis potential buyers per listing are 13.9% higher in Brisbane and 24.3% higher in regional Queensland.
Property listings
New listings in Brisbane increased by 5.8% in May 2022 to be 8.5% higher year-on-year. In regional Queensland, new listing were 3.4% higher over the month and 5.8% higher year-on-year.
In Brisbane total listings increased by 8% in May 2022 but were 11.9% lower year-on-year and were 39.9% below their decade average.
In regional Queensland, total listings rose 2.4% over the month but were 19% lower year-on-year and 51.8% lower than their decade average.

Western Australia
Dwelling prices in Perth rose by 0.2% in May to be 8.5% higher year-on-year, their slowest rate of growth since November 2020.
In regional WA prices fell 0.4% in May, their third consecutive monthly decline, while year-on-year prices were 10.7% higher.
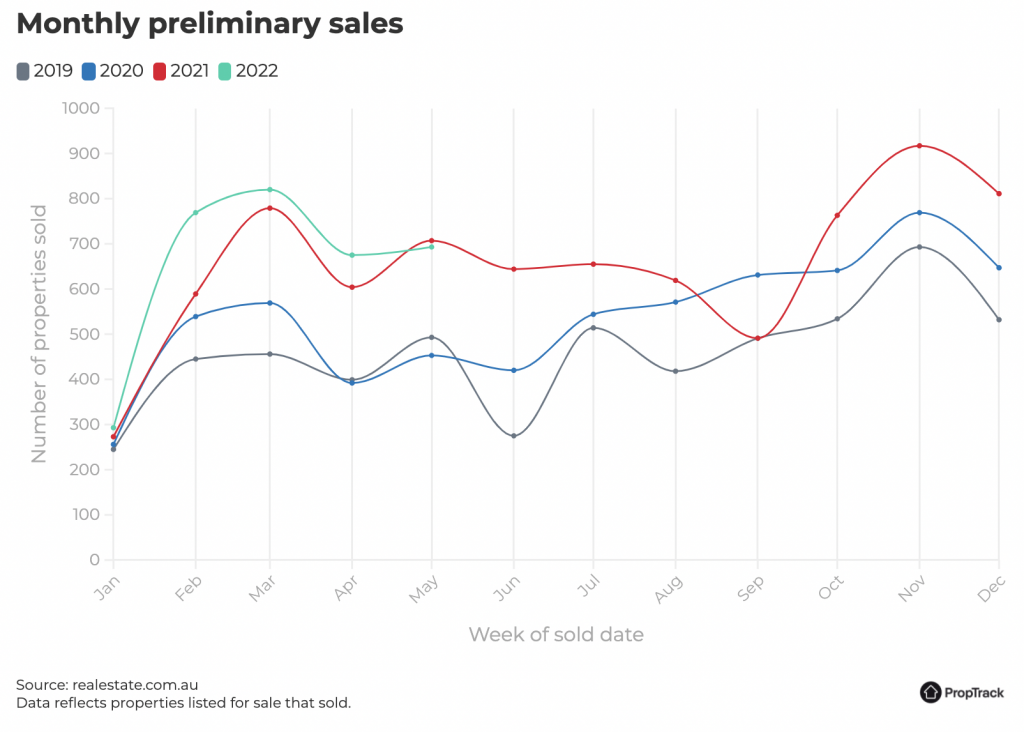
Sales volumes
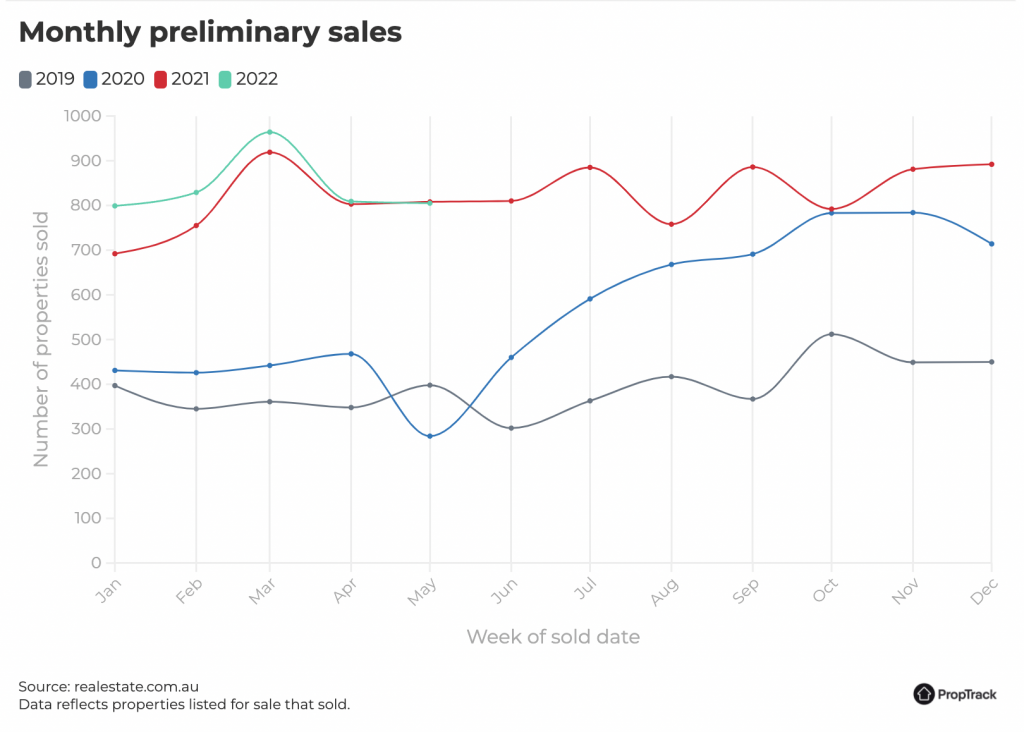
In May 2022, preliminary sales in Perth rose by 6.6% over the month and were 7.6% higher year-on-year. In regional WA, sales were 0.5% lower over the month and 0.4% lower over the year.
Days on site
Perth’s median days on site rose from 51 days in April to 56 days in May, marginally higher than the 55 days a year earlier.
In regional WA, days on site rose from 75 days to 79 days in May, still well below the 92 days a year earlier.
Potential buyers
Perth potential buyers per listing fell 0.7% in Perth during May, and 3.8% in regional areas. Year-on-year potential buyers per listing rose 12.2% in Perth and 27.7% in the regions.
Property listings
The number of new listings in Perth rose 14.5% in May 2022 to be 7.6% higher year-on-year and 19.8% above the decade average. In regional WA, new listings were 20.3% higher over the month, 9.9% higher year-on-year and 5.4% above the decade average.
The total number of properties for sale in Perth rose 5.3% in May 2022 but was still 1.1% lower year-on-year and total listings were 13.8% below their decade average. In regional WA, total listings were 1.8% higher over the month but 17.6% lower year-on-year and 46.8% lower than their decade average.
South Australia
Adelaide dwelling prices increased by 0.6% over May while in regional SA prices rose by 0.3%.
Over the year, Adelaide prices have risen 24.2%, while in regional SA prices were 20.7% higher.
Sales volumes
Preliminary monthly sales in Adelaide rose by 13.2% over the month while in regional SA they fell 2.8%.
Over the first five months of the year, preliminary sales are 4.2% higher in Adelaide compared to the same period a year ago, and 1.9% lower in regional areas.
Days on site
Median days on site in Adelaide was 24 days in May, down from 30 days a year earlier. In regional SA, days on site rose from 52 days in April to 58 days in May, but was still well down on the 100 days a year earlier.
Potential buyers
The number of potential buyers per listing fell 0.3% in Adelaide over the month, and 28.9% year-on-year.
In regional SA potential buyers per listing is down 1.5% on month, and 74.4% year-on-year.
Property listings
In Adelaide, new listings rose over the month (18.5%) in May to be 11.9% above their decade average. In regional SA, new listings were also higher over the month (1.7%) but were 5.3% below their decade average.
Total listings rose 6.9% in Adelaide during the month, but were 14.8% lower year-on-year and 35.2% below their decade average. In regional SA, total listings fell 2% in May 2022 to be 34.6% lower year-on-year and 61.1% below their decade average.
Tasmania
Dwelling prices fell for a second consecutive month in May, down 0.1% while in regional Tasmania prices continued to rise albeit at the slower pace of 0.5%. Over the past 12 months, Hobart prices were 19.2% higher while in regional Tasmania prices were 23% higher.
Sales volumes
Preliminary sales volumes in Hobart increased by 3% month-on-month but were 11.6% lower year-on-year. In regional Tasmania, sales rose 21.6% over the month in May 22 but were 1.6% lower year-on-year.
Days on site
The median days on site in Hobart rose to 58 days in May from 51 days in April. In regional Tasmania, days on site rose from 42 days to 43 days over the month although this was still lower than the 47 days a year earlier.
Potential buyers
In Hobart, the number of potential buyers per listing fell 2.6% over the month to be 24.7% lower year-on-year, while in regional Tasmania they fell 6.9% on month to be 10.2% lower year-on-year.
Property listings
New listings in Hobart increased by 1.7% in May to be 9.5% higher than the decade average. In regional Tasmania, new listings were 6.1% lower over the month, remaining 8.3% below their decade average.
Total listings in Hobart increased by 8.5% in May to be 37.7% higher year-on-year however, they were still 41.6% lower than the decade average. In regional Tasmania, total listings rose 4% over the month and were 12.8% higher year-on-year however, they were 59.4% below their decade average.
Northern Territory
Darwin dwelling prices increased by 0.1% in May 2022 to be 8.6% higher year-on-year.
In regional NT, prices were 0.2% higher over the month and 1.7% higher year-on-year.
Sales volumes
In Darwin, preliminary sales volumes fell 2.3% in May, while they were 30.3% lower in regional NT.
Over the first five months of this year preliminary sales in Darwin were 24.9% higher compared to last year and 20% lower in regional areas.
Days on site
Darwin’s median days on site rose from 26 days in April to 32 days in May, which was also higher than the 27 days a year earlier. In regional NT, days on site rose from 76 days in April to 113 days in May, which was also higher than the 108 days a year earlier.
Potential buyers
The number of potential buyers per listing in Darwin rose 3% during the month but remained 6.2% lower year-on-year.
In regional NT, potential buyers per listing were down 4.1% on month, but remained 18.3% higher year-on-year.
Property listings
In Darwin, new listings increased by 21.5% in May to be 43% higher than their decade average. In regional NT, new listings rose 31.5% over the month but were 6.5% below their decade average.
Darwin’s total listings rose 5% in May to be 15.7% higher year-on-year, but still 9.4% below their decade average.
In regional NT, total listings rose 0.5% over the month and were 15.4% lower year-on-year and 21.7% below the decade average.

Australian Capital Territory
Canberra dwelling prices fell 0.1% in May, their first monthly fall since April 2019, while over the past 12 months prices were 19.5% higher.
Sales volumes
In May, preliminary sales volumes rose 2.7% however they were 2% lower year-on-year. Sales volumes remain 10.1% higher year-to-date compared to the same period last year.
Days on site
The median days on site in Canberra increased to 26 days in May 2022 from 24 days in April 2022 with days on site sitting at 24 days in May 2021.
Potential buyers
In May 2022 there was a 1.9% increase in potential buyers taking the, 2.8% higher year-on-year. When viewed on a per listing basis the changes were +2.5% and -2.3% respectively.
Property listings
In May, there was a 3.6% monthly increase in new listing, taking them 12.9% higher year-on-year and 32.4% above their decade average.
Total listings for sale were 0.5% lower over the month but they were 9% higher year-on-year and 0.5% below their decade average.
source click here